
This post is an opinion. The mix of traditional and simplified characters is intentional.
Made with R and Inkscape.

chart planet
visual communication of data
This post is an opinion. The mix of traditional and simplified characters is intentional.
Made with R and Inkscape.

Lawful – following the best data visualization rules.
Neutral – basically following the defaults.
Chaotic – doing some “design”.
Good – trying to provide information in a clear way.
Neutral – you just need numbers, here are your numbers.
Evil – let’s pick fancy chart!
How is the pie chart among “good” ones?
What: Type distributions among men and among women.
When: Data was gathered in 2018.
Where: A selection of mostly western countries with representative samples.
Source: MBTI Manual Global Supplements Series | The Myers-Briggs Company (themyersbriggs.com)
What: % of all respondents in a country which represent this type. Country = 100% , but wider bars indicate, that this % of this type is among the top 3 highest in all listed countries. If you’re looking for this type – it is best to look in this country.
When: Data was gathered in 2018.
Where: Only the countries with representative samples are portrayed in the chart.
Source: MBTI Manual Global Supplements Series | The Myers-Briggs Company (themyersbriggs.com)
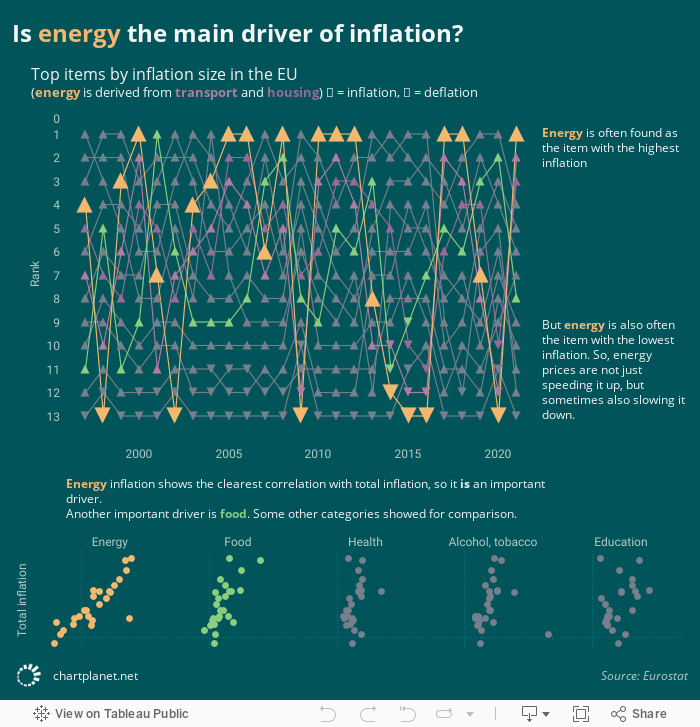
What: Annual inflation of different items. “Energy” is an aggregate compiled from “Transport” and “Housing” items, so it does overlap with them.
When: 1997-2021
Where: European Union – from 15 countries in 1996, to 27 countries in 2021.
Source: Eurostat database

What: Annual inflation rate and 3-month interbank rate.
When: Every month from January 1990 till January or February 2022 (latest data available).
Where: All countries available in the OECD database (OECD countries + some other countries) which have data for 2022 (that’s why no China here) except Luxembourg.
Source: OECD

What: The chart shows average daily gain in $ if $1000 were invested at a date on x-axis. Total gain was divided by the number of days between the day of investing and June 13, 2021. Gains were calculated on average 30-day prices.
When: from March 28, 2013, till June 13, 2021
Source: investing.com and coingecko.com
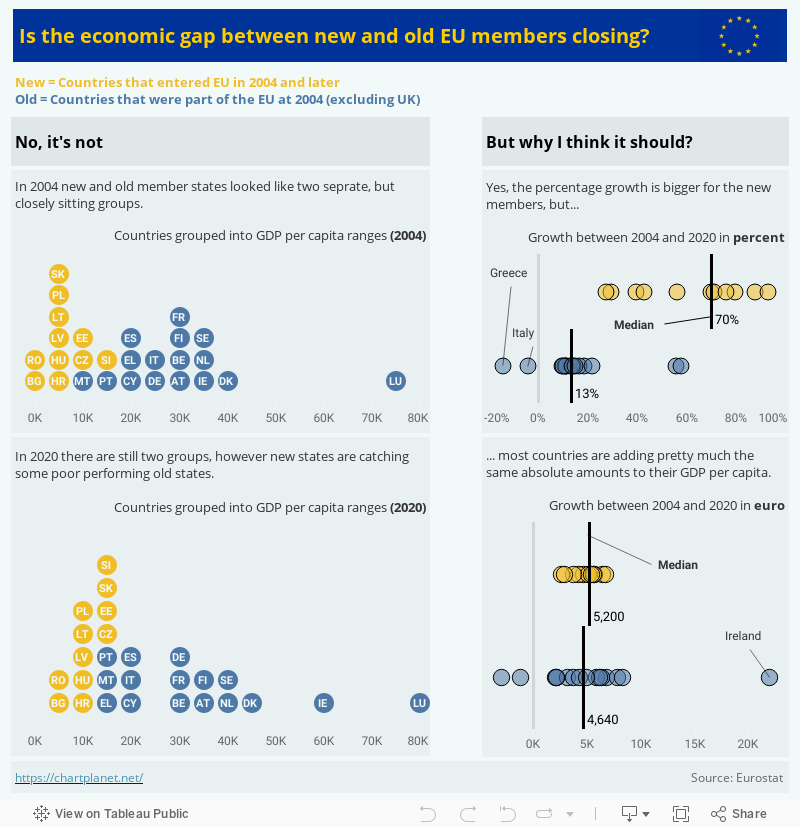
What: GDP per capita, chain linked volumes (2010) in euro
When: 2004-2020
Where: Current EU members (as of 2021)

In the Northern hemisphere the summer is warmer than the winter (i.e. normal), in the Southern hemisphere the winter is warmer than the summer (i.e. Australian), around the equator there is not much difference during the year.
What: The difference between monthly mean temperature and annual mean temperature.
When: Some weather stations have data since the XVIII century.
Where: All the weather stations in the world binned at each 10th latitude. Only stations with full-year datasets used in calculations.
Source: Global Historical Climatology Network-Monthly (GHCN-M) temperature dataset https://www.ncdc.noaa.gov/ghcn-monthly

The question arises because we’re having Climate Change and not Global Warming.
Only 6 weather stations in the world have a statistically significant negative temperature trend since 2000.
Most of them are located around the equator, one is in Antarctica.
There are 391 weather stations that have at least 5 full years of data since 2000 and which have a significant trend (p-value is less than 5%).
In 385 of those stations, the temperature is rising.
When: 2000 January – 2020 December.
Where: Weather stations that have at least 5 full years of data during the period in question and have a significant regression coefficient (p-value < 5%).
Source: Global Historical Climatology Network-Monthly (GHCN-M) temperature dataset https://www.ncdc.noaa.gov/ghcn-monthly

What: share of the total world’s GDP
When: 1990-2019
Where: top 14 world countries by GDP each year
Source: Worldbank database
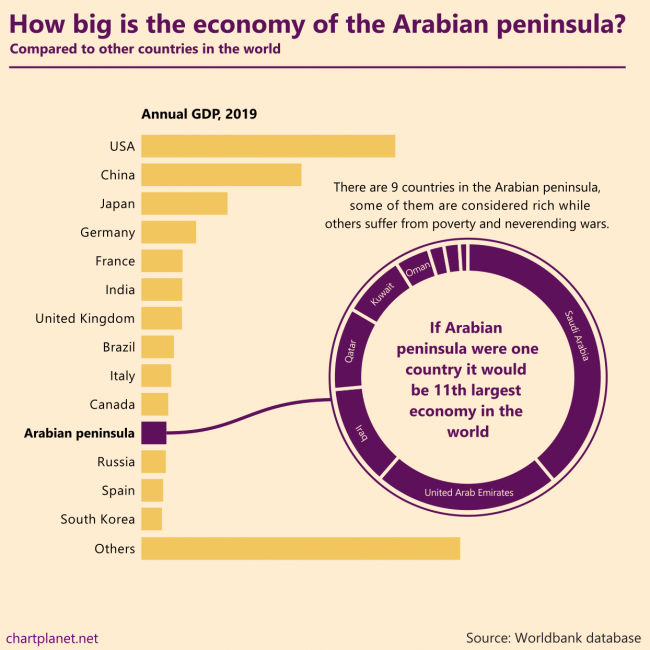
There are 9 countries in the Arabian peninsula, some of them are considered rich while others suffer from poverty and never ending wars. If the Arabian peninsula were one country it would be the 11th largest economy in the world.
What: GDP in constant 2010 USD
When: 2019
Where: All the countries in the world. “Others” were calculated by subtracting the shown countries from the total world GDP estimated by Worldbank. Countries of the Arabian peninsula are Saudi Arabia, United Arab Emirates, Iraq, Qatar, Kuwait, Oman, Bahrain, Jordan, Yemen.
Source: Worldbank database

ASEAN is an economic union of Southeast Asian countries. From 1999 to 2019 it experienced considerable growth becoming the 5th largest economy in the world if we count the EU as one unit as well.
Indonesia is the biggest country in the union, but all of them contribute to growth, most growing their GDP by more than 5% a year during 1999-2019 with the only exception being Brunei.
For comparison: the annual average growth in the EU was 1,6% a year and in China, it was 9,0% during the same period. The current composition of the EU was used for the calculations.
What: GDP in constant 2010 USD
When: 1999-2019
Where: All the countries in the world. “Others” were calculated by subtracting the shown countries from the total world GDP estimated by Worldbank.
Source: Worldbank database
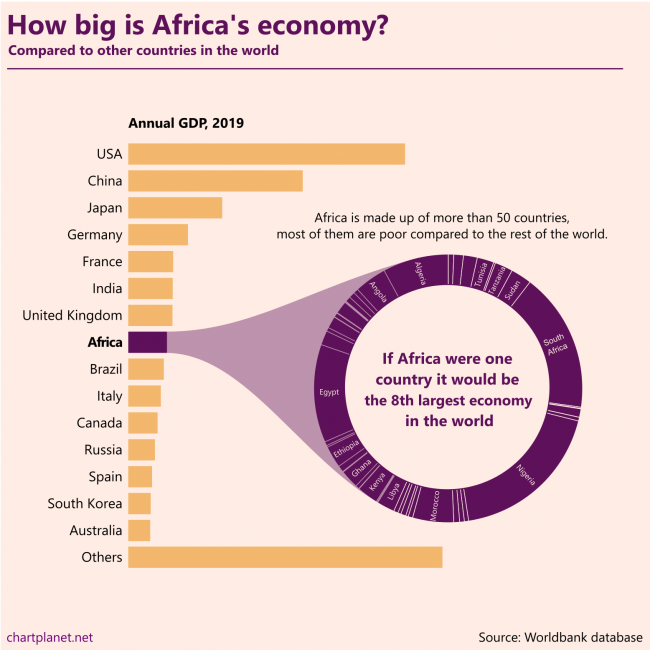
Africa is made up of more than 50 countries, most of them are poor compared to the rest of the world. If Africa were one country it would be the 8th largest economy in the world.
This chart is made without any numbers intentionally, they’d distract from the message. The ranking of the countries in the donut chart is “Algeria first”.
What: GDP in constant 2010 USD
When: 2019
Where: All the countries in the world. “Others” were calculated by subtracting the shown countries from the total world GDP estimated by Worldbank.
Source: Worldbank database
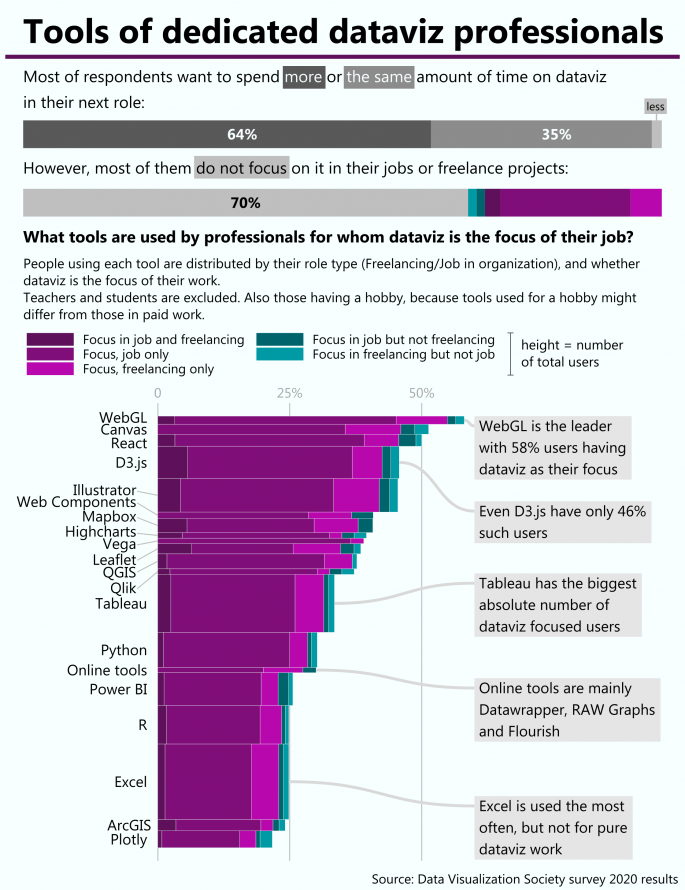
There are variety of tools to do dataviz and for someone who is just starting it is quite difficult to select which one to learn. One possible criteria might be whether this tool is used by professions focused on dataviz. R is focused on statistical analysis, Excel on spreadsheets, and python might be used for everything. So what is the tool which dedicated dataviz professionals use? The conclusion is that there is no such tool, because dataviz is more like a skill useful in many cases (financial reporting, UX design, journalism, etc.) rather than a profession by itself.
This is my submission to the Data Visualization Census Survey 2020 Challenge by Data Visualization Society a bit updated from the original based on comments by the jury. Visit their site to see the winners!
>> My original entry <<