
Let’s Bring Some Data Density to Financial Presentations
The article first appeared at Nightingale – the Journal of Data Visualization Society.
If you’re working in the financial department of a company or just dealing with financial data, you may be familiar with the Previous-Budget-Actual bar chart. It’s frequently used, occupying critical presentation and dashboard space, but sadly it lacks data density, contributing only three observations.
Managers rarely have time to thoroughly explore financial presentations, that is why you need to make as much information available as quickly as possible — an easily readable data-dense visualization serves this purpose well. In my pursuit to make denser bar charts, I found five techniques that I will share here.
All the examples are made with Excel.
The basic chart
This type of chart is used to represent a wide range of values, but in the world of finance, these are usually revenue, expenses, and profit.
The basic chart usually looks like this — one bar for the value of the present period — it might be a year, a quarter, a month or even a day. One bar for the value of the corresponding period in the budget, and the last bar for the value of the corresponding period of the previous year, or just the previous period. Time might run from left to right and from right to left in such charts.
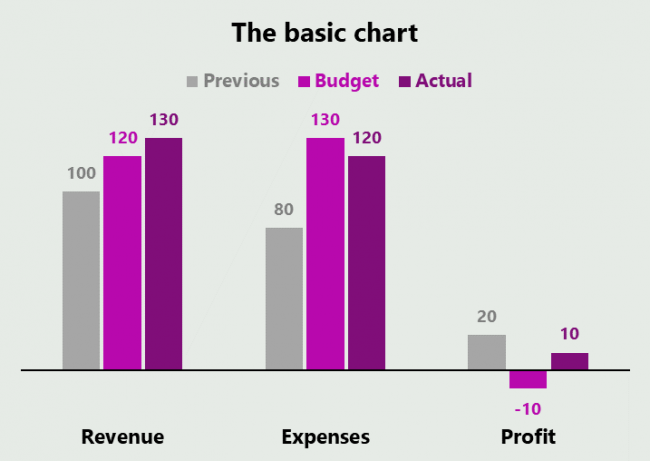
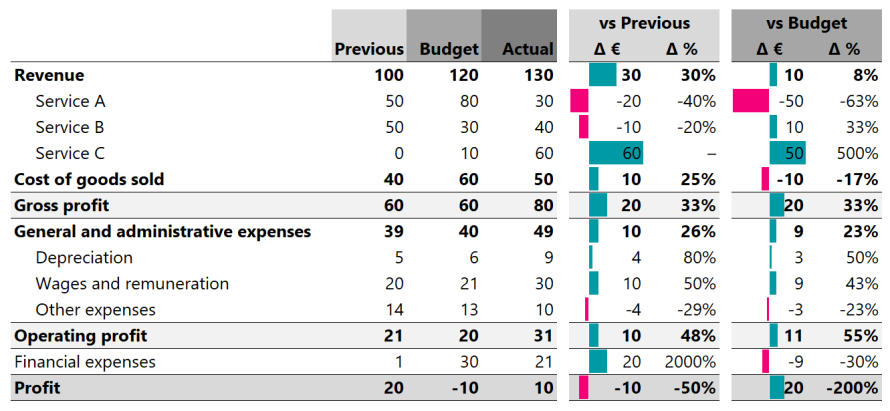
Each column represents one number, all of which could fit well into one small table. Drilling into the data a bit more results in the usual profit-loss statement.
And by adding difference columns, this table becomes an intuitive (to an experienced eye) and informative representation of company results. This is probably the densest way to show this data: the all-in-one solution as depicted in the table below.
But sometimes you need a more visual way to show the results and you don’t need the whole detailed profit-loss statement. In the techniques that follow, I am demonstrating situations where just revenue, expenses, and profit are needed.
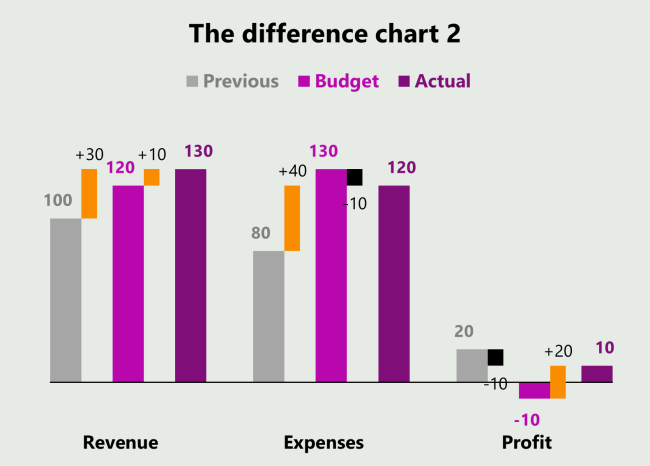
1. Adding the difference
The first way to add density is to add the difference between the actual, previous, and budgeted values because that is the objective of this chart. I have even encountered a version of this chart where only the differences were shown.
Here are two ways to add difference. The first method is simpler — additional bars are added beside those showing the absolute values. They must have a distinct style to distinguish them from absolute value bars and may be colour-coded for the increase and decrease.

Another option is not as intuitive at first glance— showing the difference in the style of a waterfall chart as a hanging rectangle beside the absolute value bar.
This one is complex to implement on Excel, but once done it could be easily reused later.
2. Adding dynamics
Another method to add density is to show data for more points in time. Such data usually looks better as lines. This enables a viewer to spot trends without losing the ability to see the current differences.

It might be tempting to label all the points in the chart, but usually, this makes the visual extremely cluttered. I recommend you stick with the actual numbers or the numbers in the focus period with axis labels and gridlines as I’ve done in the example. Also, you must put more thought into colour choices to better distinguish the lines. Here I changed dark purple for Actual to black for better contrast.
3. Adding contributions
The next approach for adding density is the contributions chart, more often called the waterfall. This technique, considered fancy in other fields, is quite common in finance.
The change in the profit is usually the emphasis of such visuals, but as you observed in the basic chart, the profit bar is often tiny when compared to the revenue bar. That is also the case for their differences. Below we have the beginning and final profits shown in absolute numbers while revenue and expenses are shown as changes, thus all the focus is on profit.

For the sake of consistency, profit numbers could be coloured in a palette introduced before (grey for previous, light purple for budget), but this only works if there are plenty of such charts, otherwise, you end up with six colours per visual, which looks like a kaleidoscope. Also, the axis with labels and gridlines becomes useful. For example, you see that if expenses stayed the same as the previous period, the profit would be 50.
If needed, you could further dissect the contributions chart, but then both comparisons with actual and budgeted values wouldn’t fit into one visual — here the profit is compared only to the previous period.
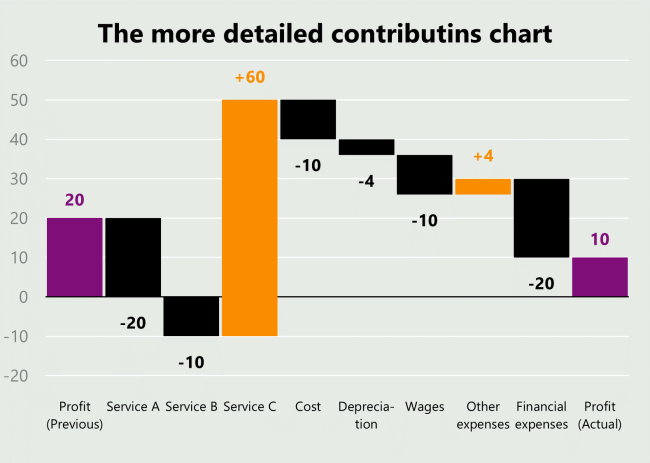
This chart is made according to instruction by Leila Gharani.
4. Reducing the size of the visual
One common way to increase density is to manage all the data into a smaller visual. A less common way is to use the dot chart, which is useful for showing changes in time of various variables. Since you have three points of time, you need a chart with three dots. This chart type requires some orientation. In my experience, some managers freak out seeing this chart the first time, but come to love it later, because it makes the differences clear.

Another approach for showing all the data in a smaller visual is the bullet chart, made specifically for such comparisons.

Both charts are a bit hacky to make in Excel — the first one requires handmade axis labels, the second one requires you utilize error bars (as described in this instruction by Jon Peltier).
5. Adding annotation
This last way to add chart density is the one I see the most often. You can add annotations to draw the reader’s attention to the most important message. These are difficult to automate, but automation is not usually necessary as annotations are intended to direct the attention to the exact place the analyst decides.

Since the annotations are done by hand they allow for more freedom and creative expression.
Which technique should you choose?
If you want an all-in-one solution — go with the table. But if the table is not an option try these techniques, every one of them serves a different purpose:
- Adding dynamics is what I use in reports because I already have tables with numbers so these charts provide additional insight.
- Adding variance is usually best for a quick at-a-glance view when the data table is not present.
- Reducing the size of the visual is useful when there are too many indicators to display. I use this option when I need to show different key performance indicators in one slide or dashboard.
- Contributions are suitable for more analytical presentations when I need to answer questions like “why” or “how.”
- I reserve Annotations for handmade PowerPoints to support decisions or emphasize questions.
More data presented in a compact visualization will save some precious seconds for managers reading it and leave those seconds for decisions.