
I was deceived!
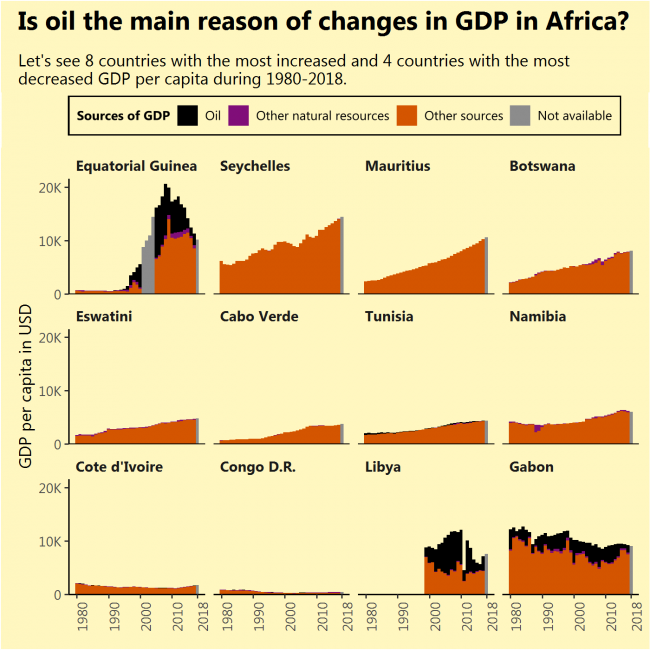
I saw that Equatorial Guinea, the African country that increased its GDP per capita the most during 1980-2018 had done this due to newly found oil. I saw that Gabon, the African country that decreased its GDP per capita the most during the same period, had done this due to diminishing its oil reserves. So I thought, the same applies to the most of rapidly growing (or contracting) African economies, but that is not true (except for Libya).
The sources of growth might not be very sustainable just like oil, but finding them requires a deeper analysis of every separate country.
What: GDP per capita divided into oil rents, rents from other natural resources and GDP from other sources. Grey bars indicate full GDP value with the unknown division.
When: From 1980 till 2018. Not all countries had a full range of data. No country had its GDP divided for 2018.
Where: Countries of the African continent with the biggest GDP per capita growth during 1980-2018 (top 8) and biggest fall (bottom 4, except South Sudan, which had very short data range)
Source: WB