↓
 

chart planet

data-human interaction

chart planet

data-human interaction

  • blog
    • dashboard design
    • data visualisation
    • Power BI asteroid
    • reviews
  • visuals
    • charts
    • interfaces
  • LT
    • grafikai
    • apie duomenų vizualizaciją
  • inspirations
  • talks
  • about

Tag Archives: Happiness

Is Thailand “the country of smiles”?

chart planet Posted on 2020-02-10 by Chart Planet2023-03-18
Is Thailand "the country of smiles"?

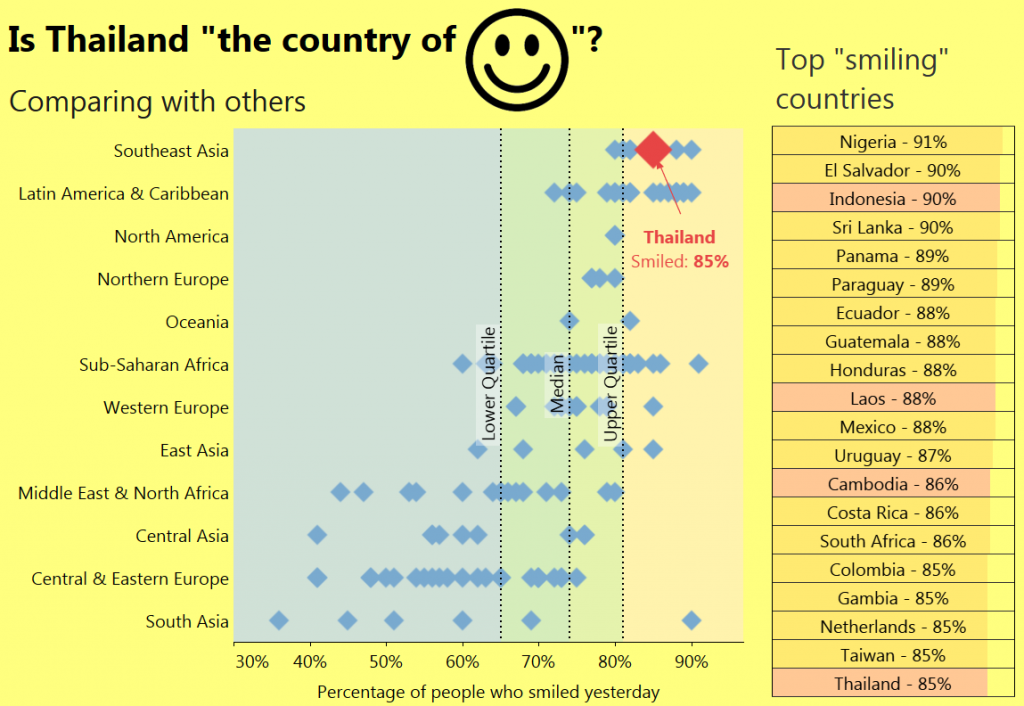
After debunking “America is the country of freedom” myth, I tried to debunk “Thailand is the country of smiles” myth. As it happens, Gallup, while doing research for their emotional indices asked people did they smile or laugh yesterday. And this data reveals that Thailand indeed could be called the country of smiles – its result is among the best in the world, however, its poorer brother Laos does better on this list.

But the whole Southeast Asia is indeed the region of smiles!

By the way, where is the secret of Nigeria? Is it Nollywood?

What: Percentage of people who replied that they smiled or laughed yesterday on an interview on emotions.
When: 2018
Where: 143 countries of the world
Source: Gallup
Posted in charts | Tagged Country specific, Happiness, Scatterplot, Tableau

Does reflective happiness correlate with positive emotions?

chart planet Posted on 2020-02-05 by Chart Planet2023-03-18
Does reflective happiness correlate with positive emotions?

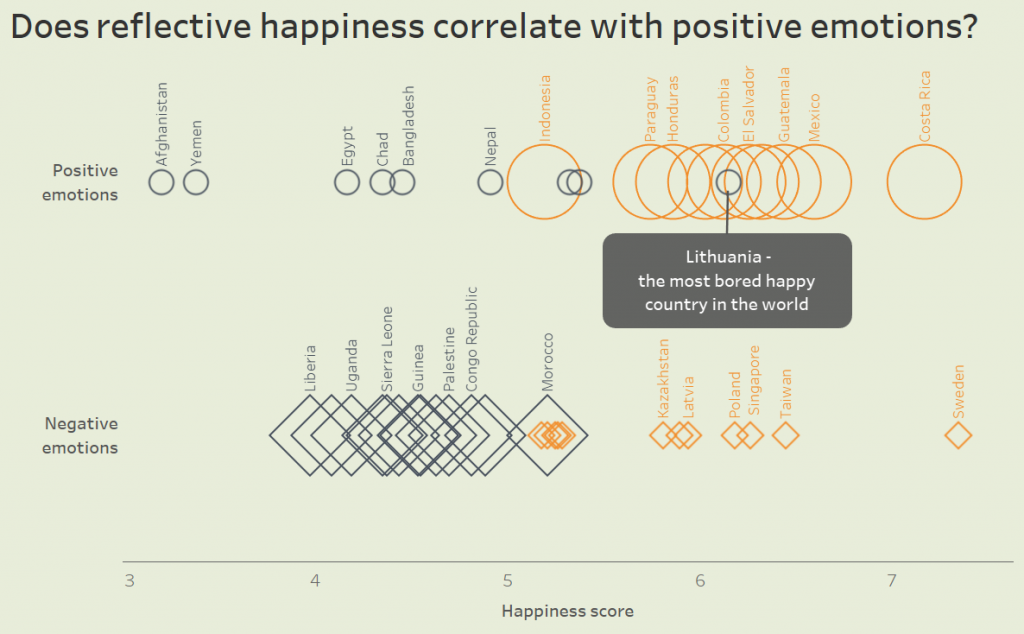
I have put countries into four categories:
– those which have the most positive emotions (big circle – excited)
– those which have the least positive emotions (small circle – bored)
– those which have the most negative emotions (big square – sad)
– those which have the least negative emotions (small square – chill)
Then I ranked them according to the World Happiness Report. I did not see any serious contradictions between these two data sets, except one country – Lithuania is quite high on happiness score, but very low on positive experiences, so it is the most bored happy country in the world.

What: Positive and Negative emotions indices based on interviews and Happiness index also based on interviews.
When: 2018
Where: 43 countries of the world
Source: Gallup for emotions and WHR for happiness

Posted in charts | Tagged Dot chart, Happiness, Tableau

What countries are the happiest and what the saddest?

chart planet Posted on 2020-02-03 by Chart Planet2023-03-18
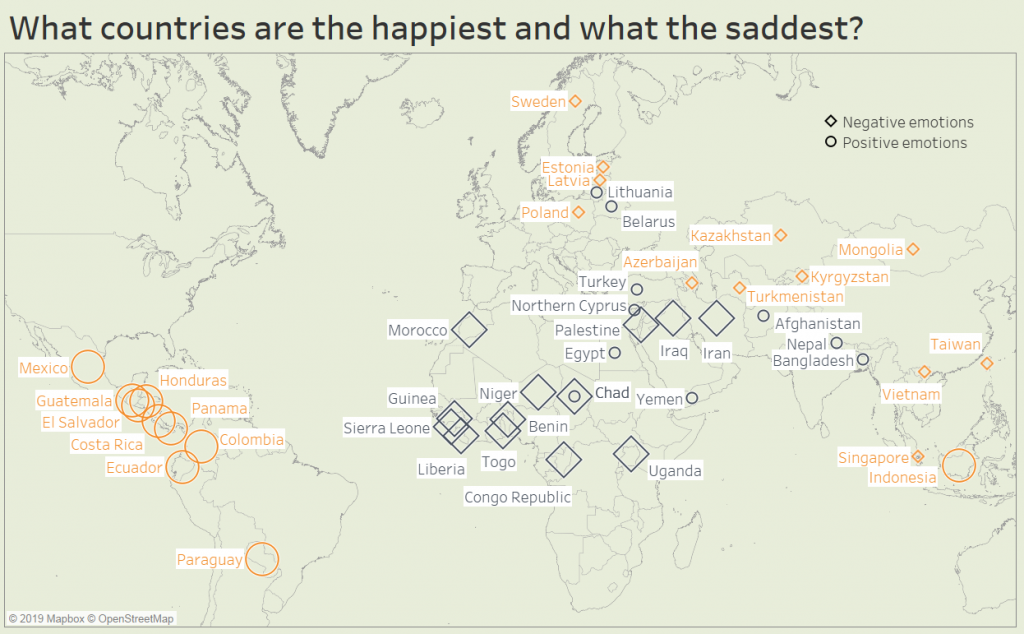
What countries are the happiest and what the saddest?

This time I am talking about daily positive or negative emotions, not the long-term reflection on life. This map shows top and bottom countries according to Positive Emotions index (circle) and Negative Emotions index (rectangle). Most of positive emotions (big circles) are in Latin America – they’re so happy and excited. Most of negative emotions (big squares) are in Africa – they’re so sad and depressed. Countries with low negative emotions (small squares) are spread across Eurasia – those people are chillin’. Countries with low positive emotions (small circles) are spread from Central Europe through the Middle East to South Asia. Those people are bored. Chad happens to be both high on negative emotions and low on positive, probably it’s the unhappiest place on the world.

What: Positive and Negative emotions indices based on more than 151,000 interviews with adults in more than 140 countries.
When: 2018
Where: 44 countries of the world.
Source: Gallup, The 2019 Global Emotions Report

Posted in charts | Tagged Happiness, Symbol map, Tableau

Is freedom the source of happiness?

chart planet Posted on 2019-12-09 by Chart Planet2023-03-18
Is freedom the source of happiness?

After comparing the happiness score and Human Freedom Index it could be said that probably yes. The correlation is 63%, so we might say that people in freer countries consider themselves happier.

What: Happiness score from World Happiness Report and Human Freedom Index
When: 2016 for Freedom and 2017 for Happiness.
Where: 147 countries of the world
Source: WHR and The Human Freedom Index 2018: A Global Measurement of Personal, Civil, and Economic Freedom

Posted in charts | Tagged Excel, Happiness, Scatterplot

What belief makes people happiest?

chart planet Posted on 2019-11-25 by Chart Planet2023-03-18
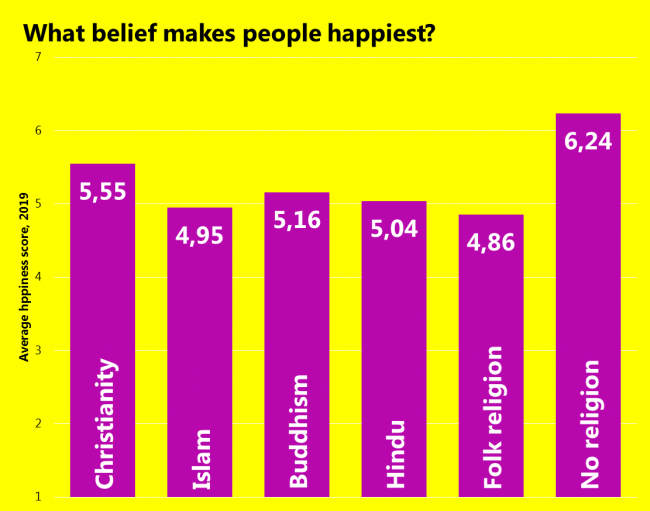
What belief makes people happiest?

Is it Buddhism? IS IT BUDDHISM? Noooo. Buddhism makes people just slightly happier than other non-western beliefs. As we’ve seen before the influence of Human Development on this score is too significant, so a mere way of thinking does not overcome people’s general attitudes towards their life as strongly as material provisions do.

What: Average happiness score from World Happiness Report by belief. It was calculated only for those countries where followers of a particular belief make more than 10% of the population and it was weighted by that percentage. Judaism and “other beliefs” were excluded because they had only 1 country complying with such criteria. It was Israel for Judaism and Taiwan for “other beliefs”. I guess that “belief” was Taoism.
When: 2019 for happiness, 2020 for religion (it’s an estimate) because the latest actual data were of 2010.
Where: 155 countries of the world.
Source: WHR and Pew Research Center

Posted in charts | Tagged Bar chart, Excel, Happiness

Is religion the source of happiness?

chart planet Posted on 2019-11-20 by Chart Planet2023-03-18
Is religion the source of happiness?

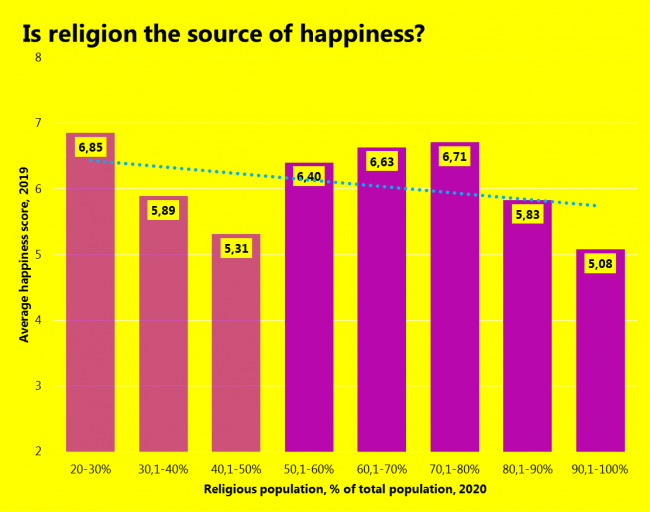
Religion has a strong influence on people’s attitudes towards their lives. Maybe being religious makes people happier? As seen from the graph it seems directly the opposite – the more religious the society the less happy they are!

The first three columns are transparent because there are less than 3 countries in their value range.

What: Percentage of the total population in a country affiliated with any religion, and happiness score from the World Happiness Report. Countries are grouped into bands of 10 percentage points by religiosity.
When: 2019 for happiness, 2020 for religion (it’s an estimate) because the latest actual data were of 2010.
Where: 155 countries of the world.
Source: WHR and Pew Research Center

Posted in charts | Tagged Bar chart, Excel, Happiness

Are sunny days the source of happiness?

chart planet Posted on 2019-11-18 by Chart Planet2023-03-18
Are sunny days the source of happiness?

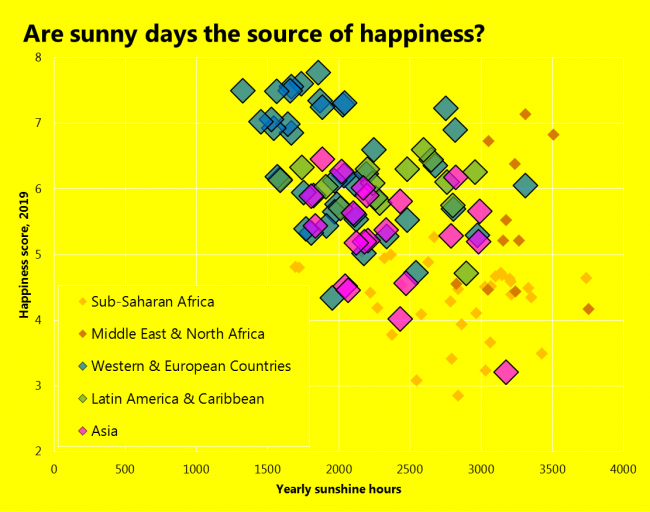
It seems like it’s the opposite. Maybe the less sun people have, the more they work to survive, the more developed they become and thus – more happy.

African countries have been made dim in this graph because they show less clear relationships – in the Sub-Saharan region, they all occupy the bottom part of the happiness chart, in the Middle East & North Africa, they occupy just a narrow band in the sunshine spectrum.

What: Happiness score from World Happiness Report and Yearly sunshine hours. Since it’s impossible to calculate sunshine hours for the whole country which might be as diverse as the USA with Florida and Alaska, a simple average of available cities was calculated.
When: 2019
Where: Countries that have both statistics. Western & European countries include Europe, USA, Canada, Australia and New Zealand.
Source: WHR and W: https://en.wikipedia.org/wiki/List_of_cities_by_sunshine_duration

Posted in charts | Tagged Excel, Happiness, Scatterplot

Is development the source of happiness?

chart planet Posted on 2019-11-13 by Chart Planet2023-03-18
Is development the source of happiness?

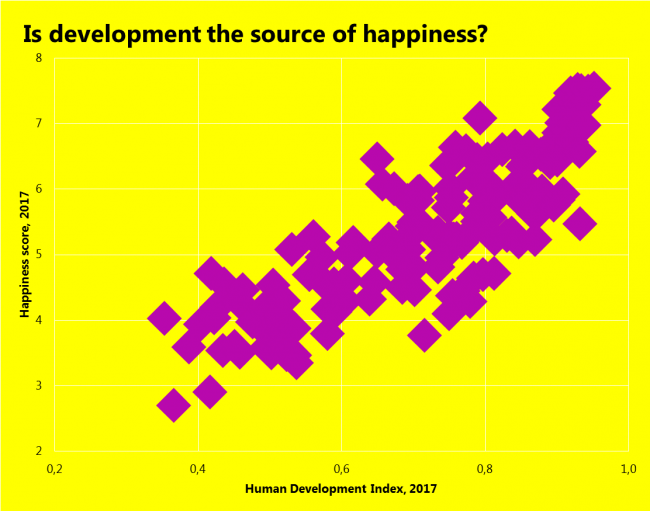
As we can see, it clearly is. The more developed the country, the more people are happy about living in it. But this particular index of happiness does not measure daily emotional experience, so, this “happiness” is not about being euphoric and excited, it’s more about overall reflection on life. Then it makes sense, that being healthy, literate and having money makes a person happy.

What: Human Development Index compared to Happiness score from World Happiness Report
When: 2017
Where: Countries that have both statistics.
Source: WHR and UNDP

Posted in charts | Tagged Excel, Happiness, Scatterplot

What world regions are the happiest?

chart planet Posted on 2019-11-11 by Chart Planet2023-03-18
What world regions are the happiest?

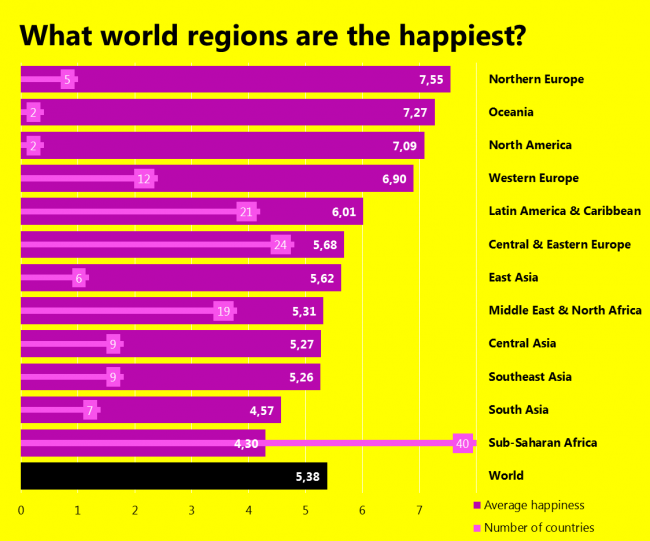
As already expected – western regions (including North America and Oceania which consist only of Australia and New Zealand in this dataset) tend to be happier than the rest of the world, and Africa and most of Asia are least happy. What is interesting, that the world average seems quite low – this is due to a large number of countries in Sub-Saharan Africa, and really small numbers of countries in the happiest regions.

What: Happiness score from the World Happiness Report. Not weighted averages by country. For most regions, maximum and minimum values were removed from the calculation.
When: Published 2019
Where: World regions modified from WB classification.
Source: WHR

Posted in charts | Tagged Bar chart, Excel, Happiness

What countries are the happiest?

chart planet Posted on 2019-11-06 by Chart Planet2023-03-18
What countries are the happiest?

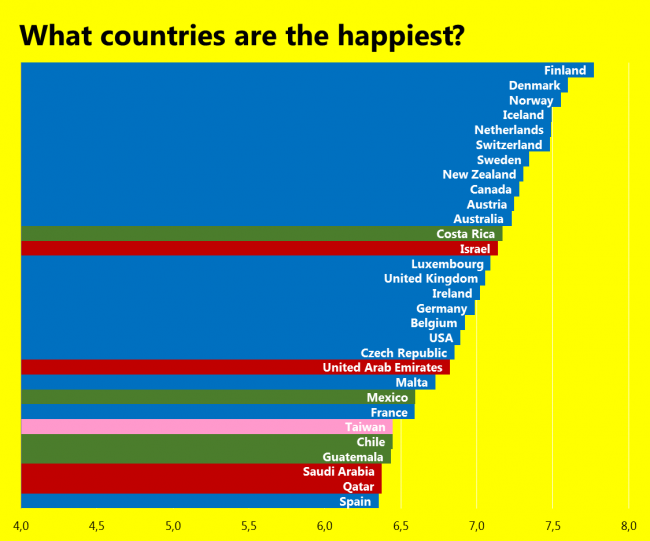
The answer is simple – Scandinavian countries. General trends are seen quite clearly – western countries (including Australia and New Zealand) take the lead, those from the far east are rare, and Africa is not present at the top at all.

What: Happiness score from the World Happiness Report. I am aware that this measure of happiness is disputed.
When: They say it’s 2019, but it’s the date of publishing.
Where: Top 30 countries of the world.
Source: WHR

Posted in charts | Tagged Bar chart, Excel, Happiness

subscribe to blog posts

Please check your email to confirm subscription

linkedin fb bluesky instagram tableau sessionize rss
MJDC privacy policy
↑
Cookies are used on chart planet.