What: Annual inflation rate and 3-month interbank rate. When: Every month from January 1990 till January or February 2022 (latest data available). Where: All countries available in the OECD database (OECD countries + some other countries) which have data for 2022 (that’s why no China here) except Luxembourg. Source: OECD
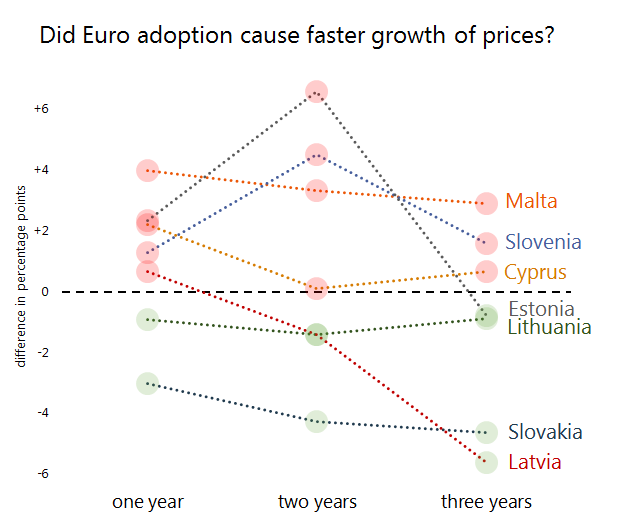
At the first year seemed that inflation was higher with euro, this was the case for 5 countries out of 7, but after 3 years have passed – only 3 out of 7 had bigger price increase with euro during the whole period. Seems that inflation rise due to euro was a temporary one-time effect which later leveled out for at least half of the countries. In short, I’d say that Euro does not cause inflation in a significant way.
What: Consumer price growth in one, two and three years before the adoption of euro subtracted from consumer price growth in one, two and three years after the adoption of euro. The number on the graph shows how much faster prices grew with Euro than without. When: Years are different for each country depending on its date of joining the Eurozone. Where: Countries which joined the Eurozone later, not with the initial group Source: ES