↓
 

chart planet

data-human interaction

chart planet

data-human interaction

  • blog
    • dashboard design
    • data visualisation
    • Power BI asteroid
    • reviews
  • visuals
    • charts
    • interfaces
  • LT
    • grafikai
    • apie duomenų vizualizaciją
  • inspirations
  • talks
  • about

Tag Archives: CO2 emissions

Do electric cars emit less CO2?

chart planet Posted on 2020-06-03 by Chart Planet2023-03-18
Do electric cars emit less CO2?

Many people still have doubts about whether the lower emissions of driving an electric car outweighs the additional impact on the environment caused by manufacturing the batteries.

Two studies (the latter is more trustworthy than the former) show that electric cars do help to reduce the CO2 emission. But how much – it depends.
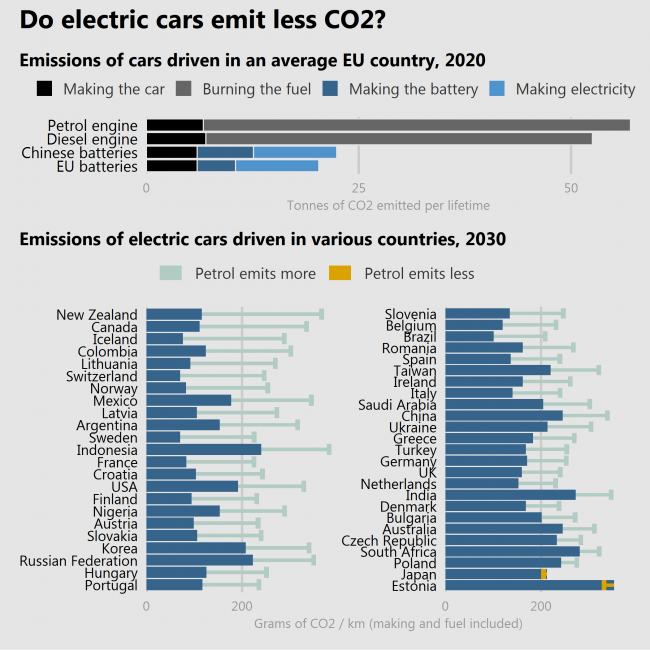
If the batteries are produced in a country where the industry is polluting more (China), reductions will be lower. If the car is driven in a country where electricity is produced by burning things (like Estonia or Poland) the reductions will be lower or even negative.
A special case is Japan, where cars are so fuel-efficient, that electric cars even raise emissions.

So, YES, electric cars are more often better than not.

What: Top = Lifetime emissions of cars in tonnes of CO2. Bottom = Lifetime emissions of cars in grams of CO2 per 1 kilometer.
When: Top = Estimate for 2020, Bottom = Estimate for 2030 with “current technological trajectory” scenario.
Where: Top = EU countries, Bottom = selected countries of the world.
Source: Top = European Federation for Transport and Environment, Bottom = Knobloch, F., Hanssen, S., Lam, A. et al. Net emission reductions from electric cars and heat pumps in 59 world regions over time. Nat Sustain (2020). https://doi.org/10.1038/s41893-020-0488-7

Posted in charts | Tagged Bar chart, CO2 emissions, R, Stacked bar chart

Are the world regions learning how to reduce CO2 emissions per dollar?

chart planet Posted on 2020-01-31 by Chart Planet2023-03-18
Are the world regions learning how to reduce CO2 emissions per dollar?

Seems like kind of yes, they do. Some regions rely on polluting industries like the Middle East, some struggle to find their direction like South Asia, but most regions do reduce. Good news for future us.

What: CO2 emissions (kg per 2010 US$ of GDP) and GDP per capita.
When: 1970-2014
Where: World regions according to WB
Source: WB

Posted in charts | Tagged CO2 emissions, Line chart, Tableau

Do more GDP per capita require more CO2 emissions?

chart planet Posted on 2020-01-29 by Chart Planet2023-03-18
Do more GDP per capita require more CO2 emissions?

As expected – no, there is a nice easily visible downward trend. It’s not the inefficiency of the USA making it one of the biggest polluters, it’s just the amount of production, while China has plenty of space to improve. There are many outliers above the general trend, and they’re mostly Middle East countries with oil plus one pink Brunei, also with oil and Estonia (probably with oil shale?) just beside Saudi Arabia.

What: CO2 emissions (kg per 2010 US$ of GDP) and GDP per capita. Colours mean regions by WB.
When: 2014 for emissions, and 2018 for GDP. I did not match the time this time 🙁
Where: 187 countries of the world
Source: WB

Posted in charts | Tagged CO2 emissions, Scatterplot, Tableau

What countries know how to make money with less emissions?

chart planet Posted on 2020-01-27 by Chart Planet2023-03-18
What countries know how to make money with less emissions?

It’s a weird graph where poor African countries go together with rich European countries – Chad and Switzerland, Rwanda and France. It tells us, that some countries switched to less energy-consuming more intellect-consuming businesses, so they can reduce emissions, but others have not yet arrived at the stage where smoking chimneys power the growth. Will they manage jump over that stage? Will they manage skip factories and dive directly into developing apps or life-coaching blogs?

What: CO2 emissions (kg per 2010 US$ of GDP) – I don’t really get is it GDP in 2010 USD, or is it just 2010 GDP everywhere. But I hope it’s the former.
When: 2014
Where: 25 countries of the world with the lowest value.
Source: WB

Posted in charts | Tagged Bar chart, CO2 emissions, Tableau

Are there countries that are net CO2 consumers?

chart planet Posted on 2020-01-22 by Chart Planet2023-03-18
Are there countries that are net CO2 consumers?

Since the forest is a net CO2 consumer, maybe there are whole countries covered in forests consuming CO2? Apparently, there are such countries, but they are tiny idyllic worlds mostly spread in the Pacific Ocean with happy exceptions of Bhutan (just beside the world’s largest polluter China) and US Virgin Islands (just beside the world’s second-largest polluter the USA).

What: Emissions of various greenhouse gasses (CO2, CH4, PFCs and so on) expressed in the equivalent of tons of CO2 emissions.
When: 2010
Where: The only nine countries with negative emissions at that time.
Source: FAO

Posted in charts | Tagged CO2 emissions, Symbol map, Tableau

What are the sources of CO2 emissions?

chart planet Posted on 2020-01-20 by Chart Planet2023-03-18
What are the sources of CO2 emissions?

I know, the data is old, but back in 2010 energy production was the main source of CO2 and other greenhouse gas emissions. Transport had the potential to overtake the land use and I bet despite all those electromobiles everywhere it did.

And the beautiful thing is – the forest is a net absorber of greenhouse gas! I knew it all along, but it is nice to see it on the graph. And it’s depressing at the same time because its absorption is tiny compared to our emissions.

What: Emissions of various greenhouse gasses (CO2, CH4, PFCs and so on) expressed in the equivalent of CO2 emissions. May not the question mislead – initially I asked about CO2, but then I found stats for all greenhouse gases. “Land use” is emissions by cropland and grassland and is not included in agriculture. “Residential, com., inst.” is emissions by residential, commercial and institutional activities. I believe the weird shape for the forest is due to inconsistency in data rather than actual changes.
When: From 1990 to 2010
Where: World aggregate
Source: FAO

Posted in charts | Tagged Bar chart, CO2 emissions, Line chart, Tableau

subscribe to blog posts

Please check your email to confirm subscription

linkedin fb bluesky instagram tableau sessionize rss
MJDC privacy policy
↑
Cookies are used on chart planet.