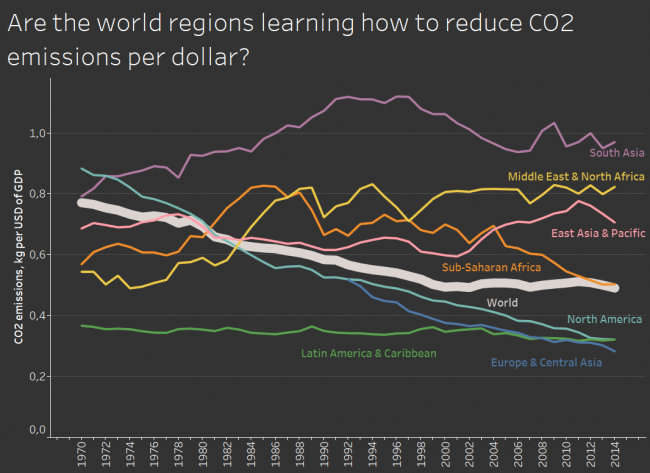
Seems like kind of yes, they do. Some regions rely on polluting industries like the Middle East, some struggle to find their direction like South Asia, but most regions do reduce. Good news for future us.
What: CO2 emissions (kg per 2010 US$ of GDP) and GDP per capita. When: 1970-2014 Where: World regions according to WB Source: WB
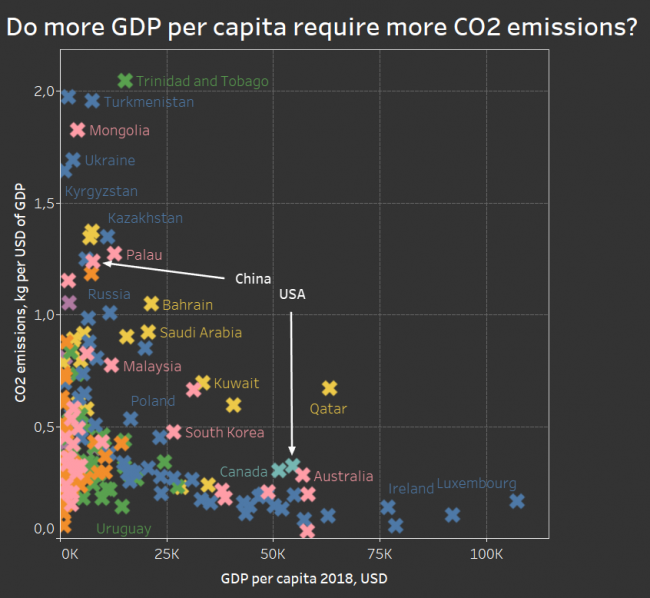
As expected – no, there is a nice easily visible downward trend. It’s not the inefficiency of the USA making it one of the biggest polluters, it’s just the amount of production, while China has plenty of space to improve. There are many outliers above the general trend, and they’re mostly Middle East countries with oil plus one pink Brunei, also with oil and Estonia (probably with oil shale?) just beside Saudi Arabia.
What: CO2 emissions (kg per 2010 US$ of GDP) and GDP per capita. Colours mean regions by WB. When: 2014 for emissions, and 2018 for GDP. I did not match the time this time 🙁 Where: 187 countries of the world Source: WB
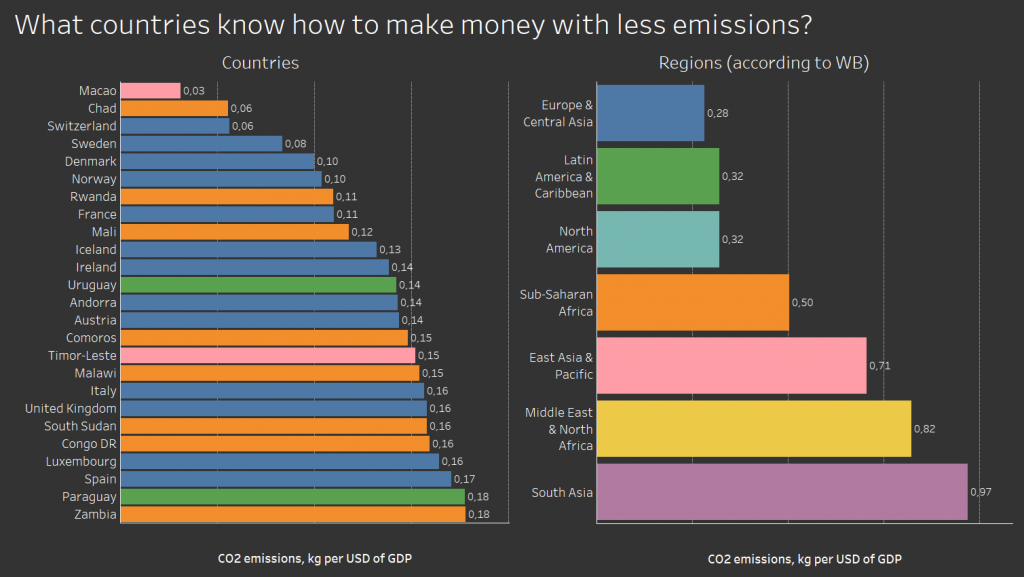
It’s a weird graph where poor African countries go together with rich European countries – Chad and Switzerland, Rwanda and France. It tells us, that some countries switched to less energy-consuming more intellect-consuming businesses, so they can reduce emissions, but others have not yet arrived at the stage where smoking chimneys power the growth. Will they manage jump over that stage? Will they manage skip factories and dive directly into developing apps or life-coaching blogs?
What: CO2 emissions (kg per 2010 US$ of GDP) – I don’t really get is it GDP in 2010 USD, or is it just 2010 GDP everywhere. But I hope it’s the former. When: 2014 Where: 25 countries of the world with the lowest value. Source: WB
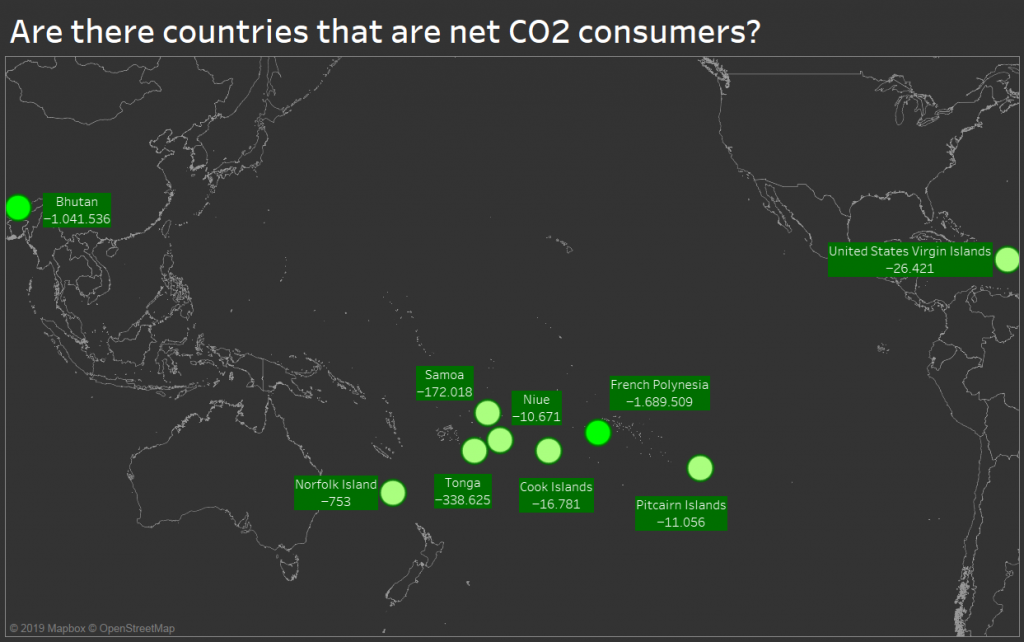
Since the forest is a net CO2 consumer, maybe there are whole countries covered in forests consuming CO2? Apparently, there are such countries, but they are tiny idyllic worlds mostly spread in the Pacific Ocean with happy exceptions of Bhutan (just beside the world’s largest polluter China) and US Virgin Islands (just beside the world’s second-largest polluter the USA).
What: Emissions of various greenhouse gasses (CO2, CH4, PFCs and so on) expressed in the equivalent of tons of CO2 emissions. When: 2010 Where: The only nine countries with negative emissions at that time. Source: FAO
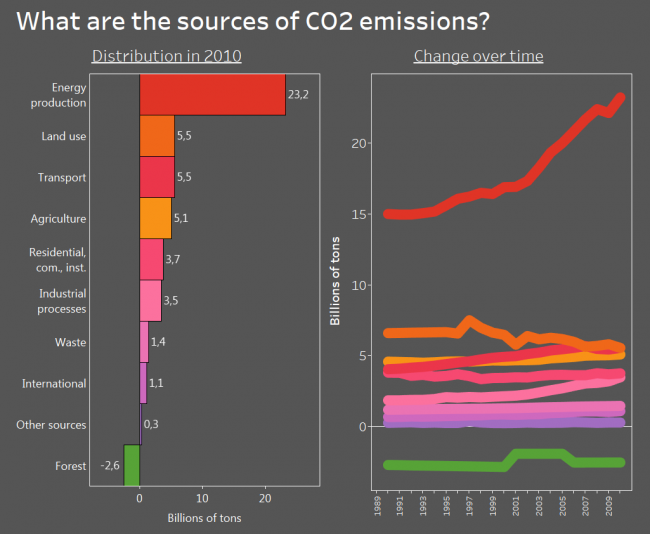
I know, the data is old, but back in 2010 energy production was the main source of CO2 and other greenhouse gas emissions. Transport had the potential to overtake the land use and I bet despite all those electromobiles everywhere it did.
And the beautiful thing is – the forest is a net absorber of greenhouse gas! I knew it all along, but it is nice to see it on the graph. And it’s depressing at the same time because its absorption is tiny compared to our emissions.
What: Emissions of various greenhouse gasses (CO2, CH4, PFCs and so on) expressed in the equivalent of CO2 emissions. May not the question mislead – initially I asked about CO2, but then I found stats for all greenhouse gases. “Land use” is emissions by cropland and grassland and is not included in agriculture. “Residential, com., inst.” is emissions by residential, commercial and institutional activities. I believe the weird shape for the forest is due to inconsistency in data rather than actual changes. When: From 1990 to 2010 Where: World aggregate Source: FAO
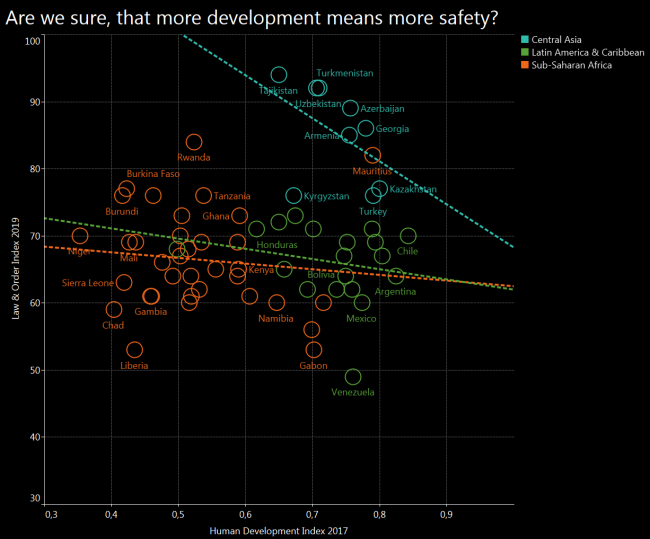
I was sure that I will get the obvious result again – more development will mean more safety. However, after cherrypicking some regions and drawing a trend line for each, I got the opposite result. Central Asia seems to follow exactly the opposite trend, and Latin America with Sub-Saharan Africa seems to be quite chaotic.
What: Law and Order (L&O) Index compared to Human Development Index (HDI) When: 2019 for L&O and 2017 for HDI Where: 63 countries from Central Asia, Sub-Saharan Africa, Latin America & Carribean, which have both indices. Source: Gallup for L&O and UNDP for HDI
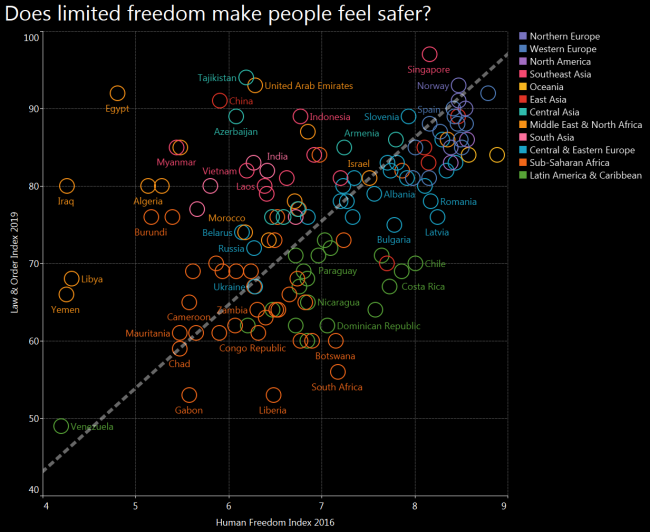
After seeing Tajikistan and Azerbaijan among the safest countries I expected to see a U shaped distribution where both free countries and suppressed countries enjoy order and stability. However there is a clear line where freedom increases together with law and order, and many exceptions from the trend scattered around.
Also, many regional patterns are visible – blue Europe being at the top left corner, orange Africa and Middle East leaning towards bottom right, and green Latin America – towards bottom left.
What: Law & Order (L&O) Index compared to Human Freedom Index (HFI) When: L&O is 2019 and HFI is 2016, both are most recent indices available at the moment of making the graph Where: 135 countries of the world, that have both indices. For example, there is no Afghanistan on this graph because it does not have an HFI index calculated. Source: Gallup for L&O and “The Human Freedom Index 2018: A Global Measurement of Personal, Civil, and Economic Freedom”
But of course it’s Northern and Western Europe! What surprises me in this graph, it’s that Central Asian countries are relatively safe, Tajikistan being among the safest!
And the least safe is Latin America – or maybe it’s just a low number of Venezuela dragging all of them down.
What: Law & Order Index, which was calculated after telephone and face to face interviews, asking questions like “Do you feel safe walking alone at night in the city or area where you live?” and similar. When: 2019 Where: 141 countries of the world Source: Gallup
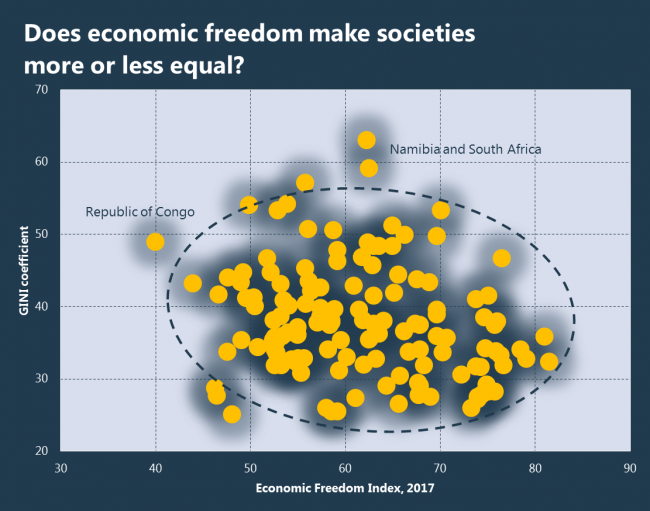
The answer to whether economic opportunities cause society to diverge into “the rich” and “the poor” or to converge into a “strong middle class” remains unanswered, because only a slight negative trend is visible. If there is any effect of economic freedom on the distribution of income in a society, measurable by the GINI coefficient, then it is weak, and easily countered by various other effects.
What: GINI coefficient – the larger it is, the more equally is the income distributed, everyone having the same amount at 100, the smaller it is the more income is concentrated in hands of the few, only one person having all the wealth at 0. And Economic Freedom Index. When: The date of GINI is different for each country, the modal year being 2015. Economic Freedom Index is of 2017. Where: 138 countries of the world Source: WB for GINI and The Heritage Foundation for Economic Freedom Index.
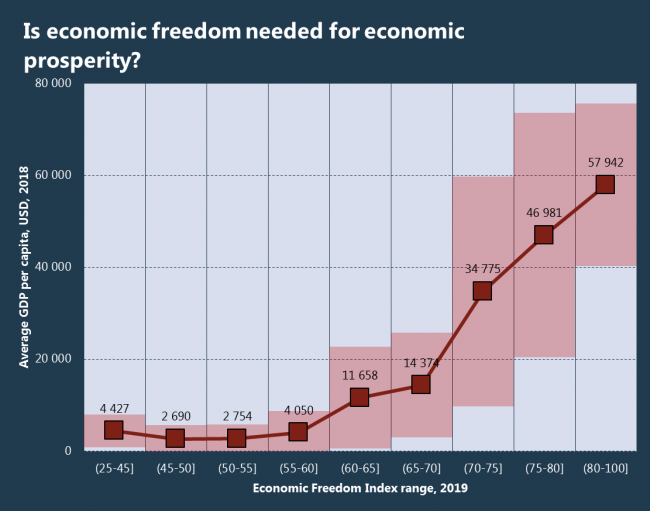
Pardon me for asking the obvious. But if less democratic countries manage to maintain high levels of HDI, maybe less economically free countries manage to reach high levels of GDP per capita? The answer is no, the relationship is clear and exponential – free economy is best. That might surprise, but even the United Arab Emirates are economically free, they rank the 9th in the world by economic freedom.
What: Average GDP per capita in USD in a given Economic Freedom Index range. The red area represents the standard deviation – with higher Index values, the GDP becomes more volatile. When: I’d say the whole graph is 2018 because Economic Freedom Index represents previous years. Where: 175 countries of the world. Source: The Heritage Foundation and WB
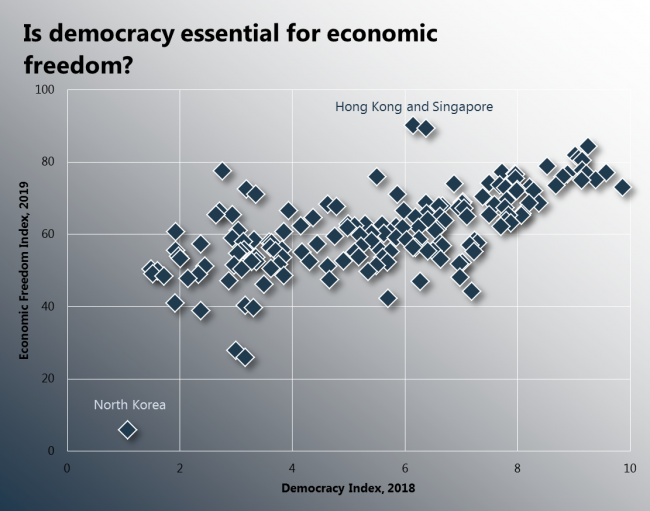
There are few real communist regimes left around the world, and even those are not really communist. So, maybe democracy and economic freedom do not correlate well? Apparently, they do. Democracy and economic freedom go together!
What: Democracy Index and Economic Freedom Index When: 2018 for Democracy and 2019 for Economic Freedom Index, which covers years 2017-2018. Where: 162 countries of the world Source: EIU for Democracy Index and The Heritage Foundation for Economic Freedom Index
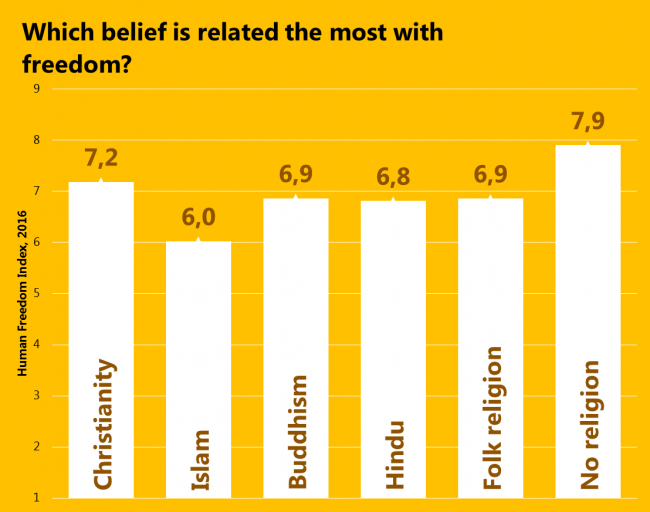
Since the freedom of religion has decreased since 2008, let’s see how beliefs themselves relate to freedom. Again, people living in the least religious countries are the freest, and those living in Islamic countries are the least free. There is a tiny nuance, that Christianity and “No religion” is the most common pair of significant beliefs in a country, so, they’re quite related. However, the second most common pair is Christianity and Islam.
What: Average Human Freedom Index by belief. It was calculated only for those countries where followers of a particular belief make more than 10% of the population and it was weighted by that percentage. Judaism and “Other beliefs” were excluded because they had only 1 country complying with such criteria. When: 2016 for Freedom 2020 for religion (it’s an estimate) because the latest actual data were of 2010. Where: 147 countries of the world. Source: Pew Research Center and The Human Freedom Index 2018: A Global Measurement of Personal, Civil, and Economic Freedom
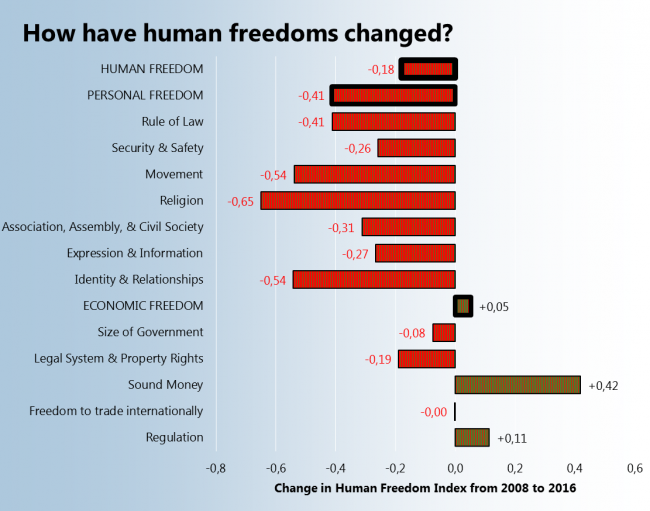
The Human Freedom Index consists of many subindexes covering various areas of people’s personal and economic life. After seeing that the average Human Freedom index of the world has decreased I decided to check what subindexes decreased the most and what increased. So, the winner is the “Sound Money” index which means, that money are safe from inflation and people can have foreign currency accounts. The loser is the “Religion” index, which mean that people have less freedom to establish and operate a religious organization.
What: Human Freedom Index – differences between subindex averages in 2016 and 2008. When: 2008 and 2016 Where: 162 countries Source: The Human Freedom Index 2018: A Global Measurement of Personal, Civil, and Economic Freedom
P.S. I must agree, those patterns on bars are terrible.